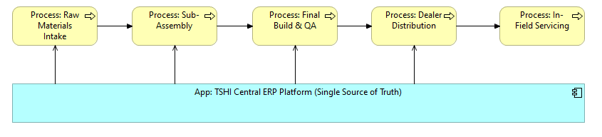
What it shows:
A high-level view of the end-to-end product journey—from initial requirements and system architecture through to manufacturing, in-service operation, and eventual disposal. Crucially, it highlights exactly where the deployed solution sits within that timeline, typically acting as the central “Single Source of Truth” (SSoT) that connects the different phases.
Why it’s needed:
Context and long-term value realization. This proves to the executive board that the core business (e.g., manufacturing vehicles, developing medical devices, or delivering financial services) is understood, not just the IT. It visually demonstrates how the deployed platform will eliminate data silos and connect teams across the entire lifespan of their products.
When to use it:
Highly recommended for SADs when deploying PLM (Product Lifecycle Management), MBSE (Model-Based Systems Engineering), or major ERP solutions. If the software being deployed is the backbone for how the business designs and builds its primary deliverables, this diagram is required to show the scale of the impact.
When NOT to use it:
Generally best to omit for back-office IT tools, pure infrastructure upgrades (storage, compute, networking), or internal utility applications (like HR portals, email migrations, or IT ticketing systems). If the project does not directly manage or touch the lifecycle of physical products or core external services, this diagram adds no value.
Example: