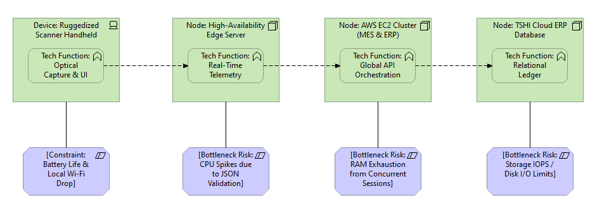
What it shows:
A cross-functional map tracking the computational workload of specific transactions as they traverse the physical IT infrastructure. It explicitly details where the processing happens (Endpoint vs. Server vs. Storage) and what kind of resource bottleneck is most likely to occur (e.g., CPU spikes, RAM exhaustion, or Disk I/O limits) for different user workflows.
Why it’s needed:
Hardware rightsizing and procurement justification. This is the primary tool to prevent financial stakeholders from accidentally crippling the project through under-provisioning. It visually proves why Systems Engineers might need expensive workstations (Heavy Client Compute), while QA reviewers can use standard laptops (Heavy Server Compute).
When to use it:
Highly recommended for SADs and LLDs when deploying “Thick Client” applications where a massive portion of the compute load sits on the end-user’s actual desk. It is also highly recommended when designing high-performance database clusters to prove where the Read vs. Write I/O bottlenecks will sit.
When NOT to use it:
Generally best to omit for simple, low-traffic web applications where neither the client nor the backend servers perform intensive processing, complex data parsing, or heavy database I/O.
Example: