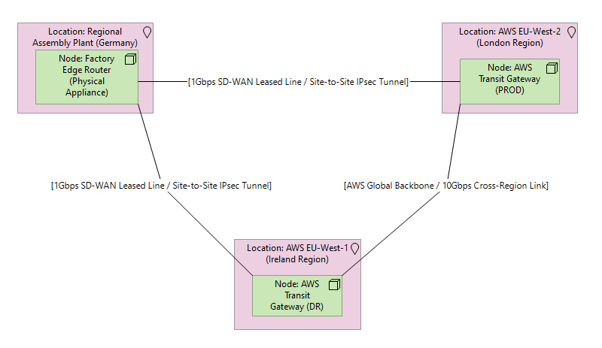
What it shows:
A macro-level map of the physical and Wide-Area Network (WAN) links connecting geographically dispersed sites, data centres, and external gateways. It details the hardware routers, physical line speeds (e.g., 10Gbps), and site-to-site encryption tunnels. How it differs from the Application Communication Diagram: The Application diagram in Phase 3 shows the logical software-to-software chatter (ports, APIs) and does not care where the servers physically sit. This Network diagram shows the physical “pipes” (fibre lines, leased lines, satellite links) that carry that chatter between different physical locations. The Application diagram is the cars and the cargo; the Network diagram is the motorways.
Why it’s needed:
Bandwidth provisioning and physical site security. This proves to the customer that a remote office or building has enough physical bandwidth to handle the new tools without crashing the site’s entire internet link. Furthermore, for InfoSec compliance, it proves that all cross-site traffic is hardware-encrypted before it ever travels across untrusted public geography.
When to use it:
Highly recommended for SADs and LLDs when deploying across multiple physical geographical locations, connecting on-premises data centres to the Public Cloud via dedicated leased lines (like ExpressRoute or Direct Connect), or extending the network to include external third-party suppliers.
When NOT to use it:
Generally best to omit for single-site deployments where all hardware and users are contained within a single building or campus. It can also be skipped if the project is purely a software upgrade and the overarching wide-area network fabric is completely out of scope and untouched.
Example: